Special case: Melissa
[An excerpt from the Fifth Annual Computer Virus Prevalence Survey:
1999]
[see also: Catching the author of Melissa]
By chance, the data collection period fell around the date of eruption of the Melissa e-mail virus. The Melissa virus hit corporate sites on Friday 26 March 1999. This MS-Word macro virus had the unusual attribute (for the time) of using standard e-mail address books as a means of forwarding infected documents to groups of 50 addresses – many of which were distribution lists, since the virus chose the first 50 items in the address books and several e-mail packages store lists at the top of their address books. There were a total of 482,869 PCs in the sample of respondents questioned after M-day.
Unfortunately, the data collected do not permit assertions about virus infections and disasters among those respondents interviewed after M-day because we lacked specific dates for the virus events that would allow us to distinguish between interviews after M-day and events after M-day.
However, we were able to calculate infection rates per 1,000 PCs per month using a conservative estimate of one week of exposure to Melissa (in our opinion, the actual exposure was about 3-5 working days).
Of the 482,869 PCs that could have been exposed to Melissa in a single week, a total of 3,650 were reported as infected by this virus, giving an infectivity of about 7.6 infections per 1,000 PCs in the total sample. If we divide by the conservative estimate of ¼ of a month, this gives an approximate average infectivity rate of ~30 per 1,000 PCs per month for all organizations (whether infected by Melissa or not). Note: this interpretation takes no account of the likelihood that once anti-virus software was updated to identify and stop Melissa; its rate of incidence would fall. Similarly, increased prevalence of macro checking by MS-Word would also interfere with Melissa’s high infectivity.
What was the infectivity of Melissa in those organizations that were actually infected? There were 48,225 PCs in the 20 infected organizations. The total PCs infected in those cases was 3,650, giving an average infection rate of 76 per 1,000 PCs for each Melissa infection. If we guess that the actual exposure to Melissa was limited to a single week, then the approximate monthly infection rate might be around 300 PCs infected by Melissa per 1,000 PCs per month in the organizations that encountered the virus if Melissa contacts were to persist in the environment.
In other words, the chance of encountering Melissa was around 30 per 1,000 PCs per month but once an organization was infected, 300 PCs might be infected per outbreak over the course of a month. Again, this estimate takes no account of the availability of updated anti-virus software and other measures that could limit the spread of Melissa.
Another way of looking at the data focused on disasters. There were 20 disasters due to Melissa in our sample. In these cases of contact with Melissa, the respondents reported a total of 48,225 PCs at risk. The estimated incidence of disasters per month per 1,000 PCs among the affected organizations was about 1.7.
In an attempt to control for the retrospective bias, we compared costs of Melissa disasters to the costs of other disasters reported in interviews after M-day.
Tables 25 and 26 show that Melissa did not cause longer downtime for servers in disasters reported in interviews after M-day than for any other cases of infected servers in the sample of respondents questioned after M-day. A Fisher’s Exact Test of independence (used because of the small cell sizes) showed that there was no statistically significant difference in the downtime distribution (p = 0.374).
Table 25. Downtime for infected servers in interviews after
M-day

Table 26. Distribution of downtime for infected servers in
interviews after M-day
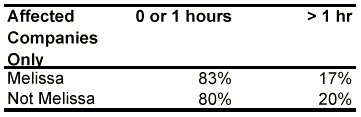
Table 27 shows how long it took for victims to recover from virus disasters after M-day for respondents questioned after M-day.
Table 27. Recovery time after virus disasters reported in
interviews after M-day
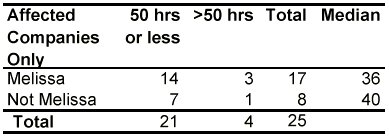
There was no significant difference in the recovery times for Melissa disasters versus non-Melissa disasters among the sample of respondents questioned after M-day; p = 0.430ns using Fisher’s Exact Test of Independence.
Table 28 shows how many cumulative person-days it took to get over the effects of the Melissa virus compared with non-Melissa disasters encountered by respondents questioned after M-day.
Table 28. Cumulative person-days (p-d) required to recover
from virus disasters reported in interviews after M-day
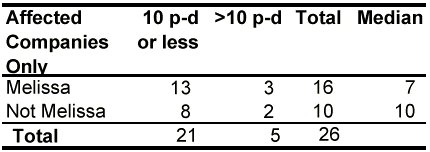
Fisher’s Exact Test for Independence showed no significant difference in the effort required for recovery from Melissa compared with that for other kinds of virus disasters (p = 0.383).
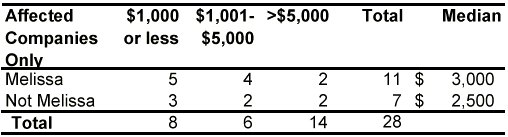
Similarly, there was no evidence of any difference in the initially estimated costs required for cleanup after Melissa disasters compared with the costs for recovery from other viruses according to respondents questioned after M-day.
Table 29 shows these data. Fisher’s Exact Test showed that these differences or larger could easily be ascribed to random sampling alone (p = 0.864).
Table 29. Recovery costs after M-day